Data Release DR1.1 | 13 Dec 2017 (first release: 6 Jun 2017)
News about this release | Browse table metadata | Documentation | Updates | Known issues with this release
💾 Download the full DR1.1 catalogue
Accessibility: World-wide accessible
Updates
Update DR1.1 | 13 Dec 2017
Updated First Data Release (DR1.1) Information
- DR1.1: Introduction
- DR1.1: What type of data is provided?
- DR1.1: Sky Coverage and Data Quality
- DR1.1: Data Access
- DR1.1: Photometric Quality
- Introduction (DR1.0)
- What type of data is provided? (DR1.0)
- Sky Coverage and Data Quality (DR1.0)
- Data Access (DR1.0)
- Improvements of DR1 over EDR (DR1.0)
- Caveats and Known Issues (DR1.0)
- SkyMapper Detectors (DR1.0)
- SkyMapper Filters (DR1.0)
- World Coordinate System (DR1.0)
- Astrometric Quality (DR1.0)
- Photometric Quality (DR1.0)
For full details of DR1.1, please see the paper by Wolf et al. 2018 (PASA, 35, 10).
DR1.1: Introduction^ Back to top
The major improvement in DR1.1 is a significant enhancement of the homogeneity of the photometric calibration. The source of our photometric calibration is now a combination of APASS and 2MASS, where the addition of the latter is used to (a) provide the direct calibration of the SkyMapper i-band and z-band photometry via interpolation between the 2MASS JK and the APASS gr photometry, and (b) refine the selection of APASS stars used for photometric calibration of the other SkyMapper bands (uvgr). The motivation for this update was the identification of photometric gradients within APASS, which gave rise to sharp transitions at the borders between APASS fields. Restricting the inputs capable of providing suitable photometric calibration has reduced the sky coverage available in DR1.0 by approximately 10%, primarily with the loss of data along the plane of the Milky Way. DR1.1 is a subset of images released in DR1.0, with no additional images included.
DR1.1: What type of data is provided?^ Back to top
Here we update the number of rows present in each of the tables available through this website and the Virtual Observatory Table Access Protocol (TAP).
Five SkyMapper-specific database tables have been exposed in this data release:
-
dr1.master— mean object astrometry, photometry and shape information from all good detections. This table should be used for most photometric queries and is also exposed through the Cone Search service (285,159,194 rows, 100 columns) -
dr1.fs_photometry— per image/CCD object detections and corresponding photometric and shape information (2,138,905,197 rows, 82 columns) -
dr1.images— a listing of image coordinates and exposure information (66,840 rows, 16 columns)
-
dr1.ccds— a listing of CCD details used by the Image Cutout service (2,124,198 rows, 14 columns) -
dr1.mosaic— a listing of the CCD positions within the SkyMapper mosaic (32 rows, 3 columns)
Note: due to the slight loss of coverage, some objects in the external spectroscopic tables have cross-matches in DR1.0, but not in DR1.1; we leave the pointer column dr1_id unchanged, so they can still be joined to rows in DR1 tables, even when a counterpart in DR1.1 is missing.
In addition, we have added (2018-01-18) the AAVSO Variable Star Index (VSX; Watson et al. 2006, 2017) to the set of external catalogues available for TAP queries.
DR1.1: Sky Coverage and Data Quality^ Back to top
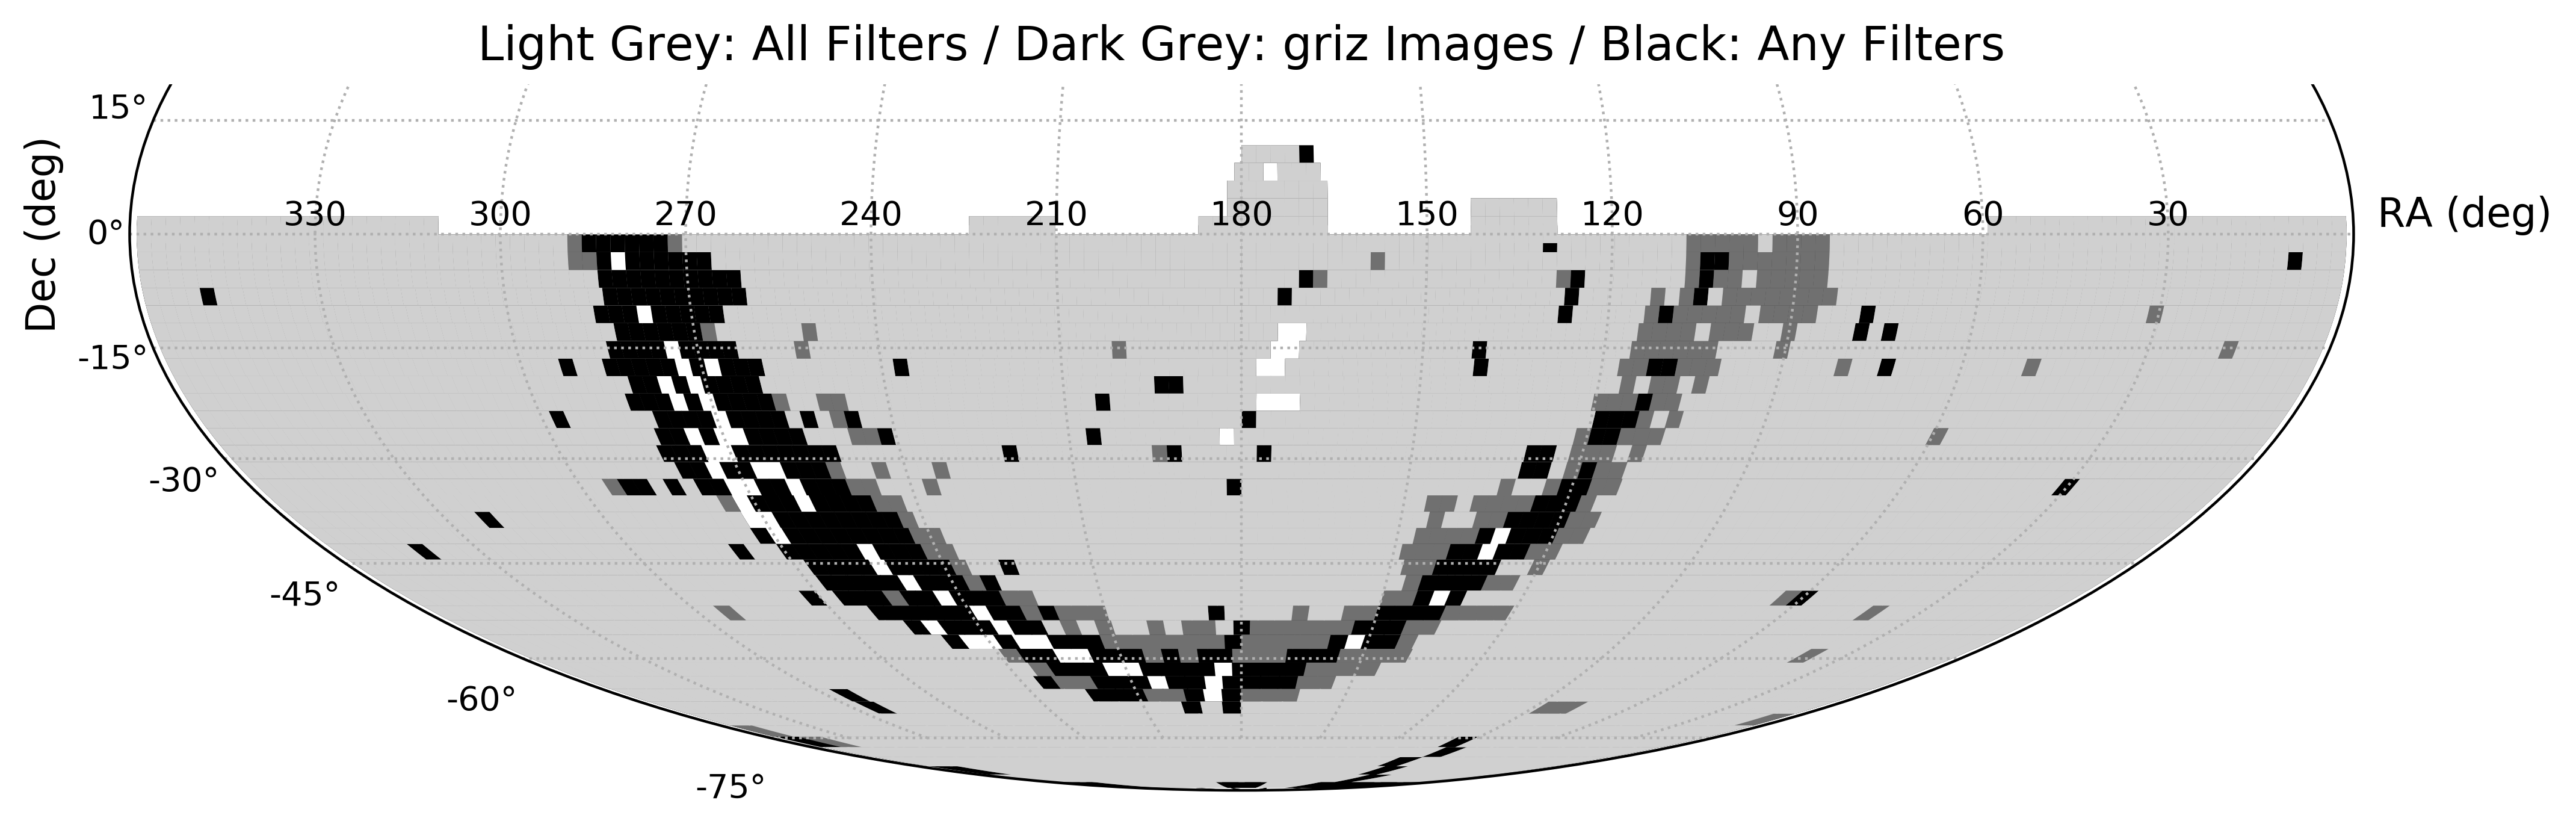
The DR1.1 data are drawn from 4,008 distinct SkyMapper fields, with varying coverage per filter. Approximately 17,200 deg2 are covered in all six filters. The sky coverage is shown below.
In addition to the flags originally indicated for DR1.0 (see here), DR1.1 includes an additional flag value of 4096 in the dr1.master catalogue (but not in the dr1.fs_photometry table) for 29 objects near the RA=0/360 border for which the photometry was not appropriately merged from the individual measurements.
DR1.1: Data Access^ Back to top
As with the original DR1.0 release, DR1.1 images and catalogues can be accessed via the tools on this website (see How To Access), which are being developed as part of the Australian All-Sky Virtual Observatory. The TAP (Table Access Protocol), SIAP (Simple Image Access Protocol), and Cone Search services can also be accessed through Virtual Observatory-aware software tools like TOPCAT and Aladin.
The catalogue tables have been structured such that previous TAP queries will now automatically interrogate the DR1.1 tables. The original DR1.0 tables can still be accessed by prepending "dr1p0_" to the table names (for the master, fs_photometry, images, and ccds tables), e.g.,
SELECT TOP 10 * FROM dr1.dr1p0_master WHERE flags=0
No modifications have been made to the images themselves, except for the selection of which images are included in DR1.1.
DR1.1: Photometric Quality^ Back to top
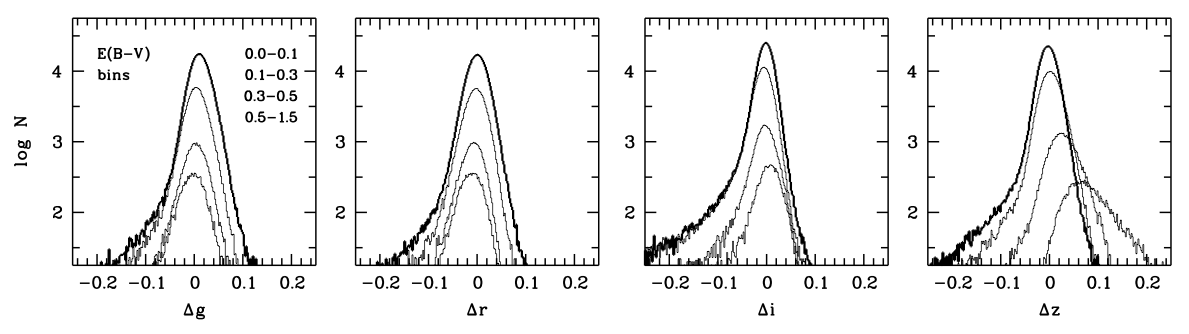
Here we show the comparison of the revised photometry of DR1.1 with the photometry from the Pan-STARRS1 Data Release 1. First, histograms of the magnitude difference between SkyMapper measurement and SkyMapper prediction from PanSTARRS measurement plus modelled colour terms in the four common, similar, filters, griz; the four histograms are for different ranges of interstellar foreground reddening. With the exception of z-band at high reddening, the mean difference is less than 0.01 mag and rms scatter is approx. 0.02 mag.
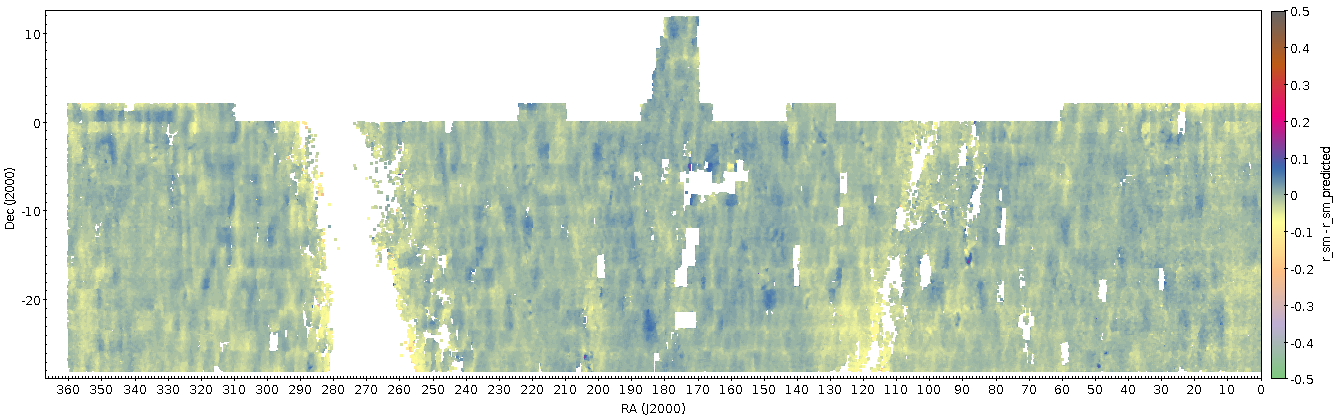
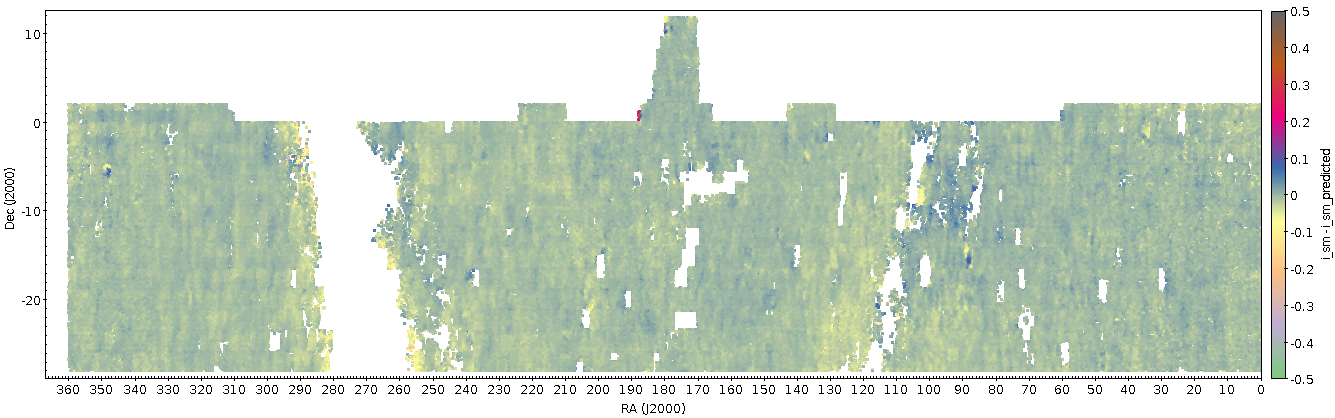
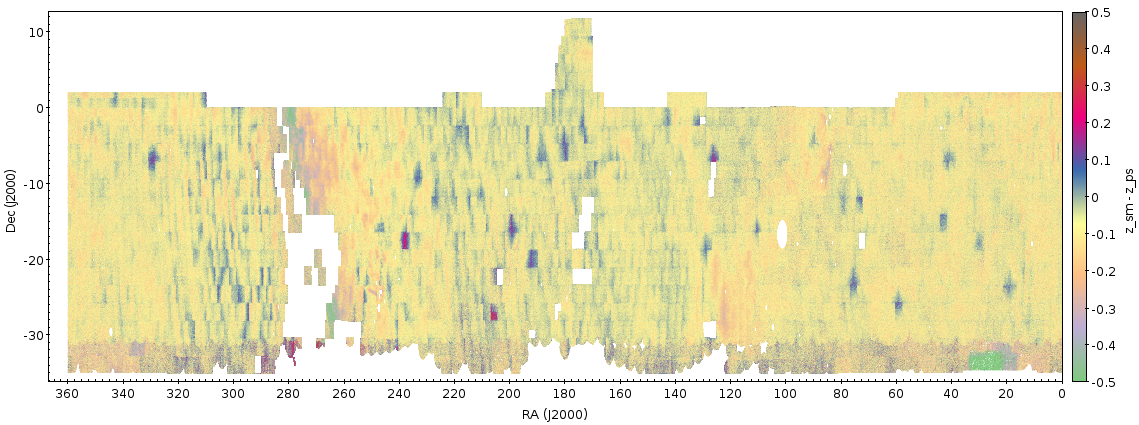
Sky maps of magnitude difference between SkyMapper measurement and SkyMapper prediction from PanSTARRS measurement plus modelled colour terms:
g-band:

r-band:
i-band:
z-band:

These maps can be compared against the DR1.0 set (raw magnitude comparison without colour terms) here.
Release documentation
Some parts of this documentation may have been superseded by one of the Updates above.
First Data Release (DR1) Information
- Introduction
- What type of data is provided?
- Sky Coverage and Data Quality
- Data Access
- Improvements of DR1 over EDR
- Caveats and Known Issues
- SkyMapper Detectors
- SkyMapper Filters
- World Coordinate System
- Astrometric Quality
- Photometric Quality
Introduction^ Back to top
The SkyMapper First Data Release provides data from the Shallow Survey across >98% of the southern sky, mostly covering the range from the South Celestial Pole to +2 deg in declination, with some extra coverage reaching +10 deg. Included are fields observed between March 2014 and September 2015, with a number of quality cuts applied. Each visit to a given field includes an exposure in all six filters, uvgriz, although on some fields (12%) not all filter images passed the quality cuts. Measurements from over 2.3 billion detections covering over 20,200 deg2 of sky are available. They correspond to ~300 million unique astrophysical objects from magnitude 8 to 18 (complete to ~17.5 mag, depending on the filter). All magnitudes reported on this site are AB mags.
Full details of the DR1 data, processing, and analysis are presented in Wolf et al. (2017, in prep.).
Please address all feedback, suggestions and bug reports in the first instance to skymapper@anu.edu.au.
Important: Please make sure you review the data access and publication policies prior to downloading or publishing DR1 data. The research collaborations which existed prior to SkyMapper becoming a national facility have been protected through a list of reserved science projects, with which other teams are prohibited from competing prior to worldwide release. DR1 is expected to be made available to the world later in 2017.
What type of data is provided?^ Back to top
DR1 contains reduced images with overscan, bias, flatfield correction and a World Coordinate System (TPV projection) applied, as well as photometric catalogues (both raw detections and object-merged) for objects in each image. Full access to the DR1 database tables is provided through this website and the Virtual Observatory Table Access Protocol (TAP).
Four SkyMapper-specific database tables have been exposed in this data release:
-
dr1.master — mean object astrometry, photometry and shape information from all good detections. This table should be used for most photometric queries and is also exposed through the Cone Search service (318,784,195 rows, 100 columns)
-
dr1.fs_photometry — per image/CCD object detections and corresponding photometric and shape information (2,379,662,040 rows, 82 columns)
-
dr1.images — a listing of image coordinates and exposure information (67,889 rows, 16 columns)
-
dr1.ccds — a listing of CCD details used by the Image Cutout service (2,157,335 rows, 14 columns)
-
dr1.mosaic — a listing of the CCD positions within the SkyMapper mosaic (32 rows, 3 columns)
The dr1.master table has been pre-matched to several other photometric catalogues. Currently, we hold local copies of the following tables:
-
ext.allwise — the NASA Widefield Infrared Survey Explorer (WISE) AllWISE data release (747,634,026 rows, 298 columns)
-
ext.apass_dr9 — the AAVSO Photometric All Sky Survey (APASS) DR9 (61,176,401 rows, 25 columns)
-
ext.gaia_dr1 — the Gaia Mission Catalogue DR1 (1,142,679,769 rows, 57 columns)
-
ext.galex_bcscat_ais — the All-Sky Imaging Survey from the Bianchi, Conti, Shiao (BCS) Catalog of Unique GALEX Sources (48,160,682 rows, 66 columns)
-
ext.ps1_dr1 — the Pan-STARRS1 (PS1) DR1 Catalog, selected columns, restricted to decMean<20deg and nDetections>1 (1,166,954,207 rows, 13 columns)
-
ext.twomass_psc — the Two Micron All Sky Survey (2MASS) Point Source Catalog (PSC; 470,992,970 rows, 60 columns)
-
ext.twomass_xsc — the Two Micron All Sky Survey (2MASS) Extended Source Catalog (XSC; 1,647,599 rows, 389 columns)
-
ext.ucac4 — the Fourth U.S. Naval Observatory CCD Astrograph Catalog (UCAC4, 113,780,093 rows, 58 columns)
- ext.yale_bsc — the Yale Bright Star Catalog (9,110 rows, 20 columns)
Matching to the external tables was attempted with a 15" search radius around each SkyMapper source and the ID and distance of the nearest source from the 2MASS, AllWISE, APASS, Gaia, GALEX, PS1, and UCAC4 catalogues are noted in the last set of columns in dr1.master. For 2MASS, the PSC and XSC were both queried and the two nearest matches from either catalogue are listed. The distance to the 2nd-nearest match may indicate the presence of a close neighbour affecting the photometry of the primary source (also see the prox column in dr1.master for the closest SkyMapper source to each DR1 object). The ext schema also contains additional catalogues that have not yet been cross-matched with DR1.
We also provide local copies of several well-known spectroscopic catalogues, which we have pre-matched to the SkyMapper master table with a 15" search radius, noting the nearest SkyMapper source in the dr1_id and dr1_dist columns of those tables:
-
ext.spec_hesqso — catalogue from the Hamburg/ESO survey for bright QSOs. III. (Wisotzki+, 2000) (415 rows, 13 columns, 373 matches with <2" search radius)
-
ext.spec_2qz6qz — catalogue from the 2dF and 6dF QSO Redshift Surveys (49,425 rows, 37 columns, 7,877 matches with <2" search radius)
-
ext.spec_6dfgs — catalogue from the 6 Degree Field Galaxy Survey (6dFGS) (124,647 rows, 16 columns, 119,971 matches with <2" search radius)
-
ext.spec_2dfgrs — catalogue from the 2 Degree Field Galaxy Redshift Survey (2dFGRS) (245,591 rows, 29 columns, 173,594 matches with <2" search radius)
To aid in constructing your ADQL queries, you can browse the column metadata of all these tables here.
Sky Coverage and Data Quality^ Back to top
DR1 consists of 4,016 SkyMapper fields covering a total area of over 20,200 deg2 (see coverage map below). Approximately, 17,600 deg2 of sky are covered with good images in all six filters.

The DR1 data were obtained from March 2014 to September 2015. During each visit to a SkyMapper field, the full six-filter sequence of uvgriz was observed, with exposure times of 40, 20, 5, 5, 10 and 20 sec. Due to the high read-out noise (RON) of ~10 e-, short exposures in the u and v filters are affected by RON. Even in full Moon, noise is sky-dominated only at t > 20 sec in the u-band. Note that the SkyMapper v-band is a violet filter, not a visual filter.
All source detections in the photometry table include the Source Extractor flags, complemented by additional flags from our data processing in a higher bit range:
- From Source Extractor:
-
1     The object has neighbors, bright and close enough to significantly bias the
	photometry, or bad pixels (more than 10% of the integrated area affected).
-
2 The object was originally blended with another one.
-
4 At least one pixel of the object is saturated (or very close to).
-
8 The object is truncated (too close to an image boundary).
-
16 Object's aperture data are incomplete or corrupted.
-
32 Object's isophotal data are incomplete or corrupted.
-
64 A memory overflow occurred during deblending.
-
128 A memory overflow occurred during extraction.
-
- Source detections, whose mag_psf or mag_petro or mag_apr15 or mag_apc05 is either NULL or >19 have been flagged in the photometry table (flag value 512). These may include real objects at very faint detection levels below 2 sigma, but are mostly spurious combinations of noise peaks with bright neighbours.
- Source detections that appear much more concentrated than PSFs and with small minor axis extend have been flagged in the photometry table (flag value 1024) as they may be affected by uncorrected cosmic rays or transient hot pixels.
- Source detections that are close to stars in the Yale Bright Star Catalog or close to stars in the Gaia DR1 catalogue wih phot_g_mean_mag<8 are flagged in the photometry table (flag value 2048), based on a search radius in degrees of log10 (radius) < -0.2 * Vmag or -0.2*phot_g_mean_mag, respectively. These are usually affected by scattered light from the bright star, and have either compromised photometry or are spurious sources.
- Sources that are known to be insifficiently merged as it happened around the RA=0/360 border are flagged in the master table with value 4096.
Only detections with flags<8 are used for the distill into the master table. Hence, the averaged magnitudes exclude all measurements with bad flags, and the master source list excludes all objects within the exclusion zones around bright stars. However, detections with bad flags or those close to bright stars can still be found in the photometry table.
Median point source completeness limits in AB mag are (17.75, 17.5, 18, 18, 17.75, 17.5) for (u, v, g, r, i, z). These are the magnitudes where the log(N) number counts start to turn away from a linear increase with magnitude.
Median seeing in DR1 is (3.1", 2.9", 2.6", 2.4", 2.3", 2.3") for (u, v, g, r, i, z). We have included images with a PSF FWHM of up to 5" (up to 6" for u and v-bands) and an elongation of up to 1.4.
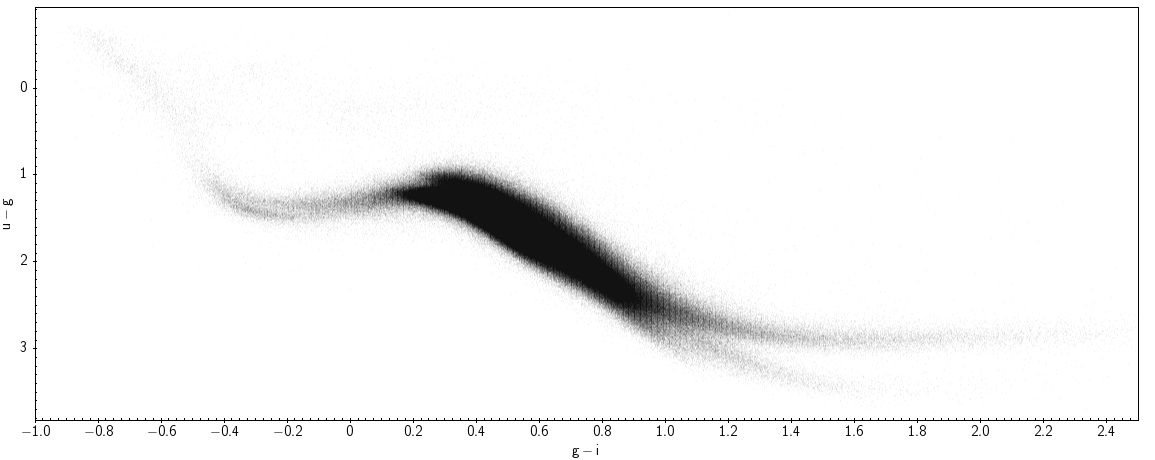
Below we show an example colour-colour (u-g vs g-i) diagram for stars with good detections:
Data Access^ Back to top
Main Page: How To Access
DR1 images and catalogues can be accessed via the tools on this website (see How To Access), which are being developed as part of the Australian All-Sky Virtual Observatory. The TAP (Table Access Protocol), SIAP (Simple Image Access Protocol), and Cone Search services can also be accessed through Virtual Observatory-aware software tools like TOPCAT and Aladin.
For TAP queries, some constraints worth considering to ensure a clean dataset of reliable sources from the dr1.master catalogue include:
- flags = 0 - no Source Extractor warnings about saturation, close neighbours, edge-of-CCD effects, etc.
- nimaflags = 0 - isophotal aperture clean of bad pixels, saturation, cross-talk, cosmic rays
- ngood > 1 - source detected in multiple images (either in the same filter or different filters)
- ngood_min > 1 - source detected at least twice in one of the filters (note that bands with x_ngood=0 are excluded from the ngood_min count)
- nch_max = 1 - source never resolved into multiple components (note that for nch_max>1 sources, n_good counts each child component separately)
- x_flags = 0, x_nimaflags = 0, x_ngood > 1 - if only concerned with filter x
- x_ngood = x_nvisit - source detected each time its position was observed (but note that approximately 1 mag of zero-point degradation was tolerated in selecting the images for DR1)
Improvements of DR1 over EDR^ Back to top
Several changes in the data processing have improved the quality of the DR1 data products:
-
In the EDR, an interference noise -- with drifting wavelength and phase, and having an average wavelength of 7 pixels along each row -- affected most images. In DR1, this noise is fit and subtracted.
-
In the EDR, a temporally unstable bias lead to bias changes during the read-out of any individual row. In DR1, the main space of bias behaviour is now modelled separately for each of the 64 amplifiers and for each night based on the bias images of the night, using a principal-component analysis. Bias residuals are then fit to every image row of every science image, after masking objects, and best-fitting residuals are then subtracted.
-
In the EDR, the bad-pixel map was incomplete and did not capture transient bad pixels and bad columns that sometime appear for periods of time and disappear again. In DR1, bias images from the whole observing period were combined into a new global bad-pixel map.
- In the EDR, cosmic-ray (CR) hits were identified based on the object shapes reported by Source Extractor and removed from the tables as far as they could be separated from real objects. In DR1, we take advantage of our relatively broad PSF to remove CR hits directly on the images using L.A.Cosmic. However, some CR hits on genuine objects will not be detected or corrected.
-
The selection of stars used for photometric calibration was refined, and where dust extinction needs to be taken into account to refine the colour transformation from APASS gri to SkyMapper uvgriz filters, it is now determined on a star-by-star basis, not on a per-CCD basis as in the EDR.
-
In DR1, a range of sources likely to be unreal or biases by scattered light has been flagged and is not included in the distilled photometry of the master table. This includes sources to faint to be significant real detections, too centrally-concentrated to be real given the local PSF, and too close to very bright stars and their scattered-light haloes.
-
More area, up from a third of the Southern sky to all of it :)
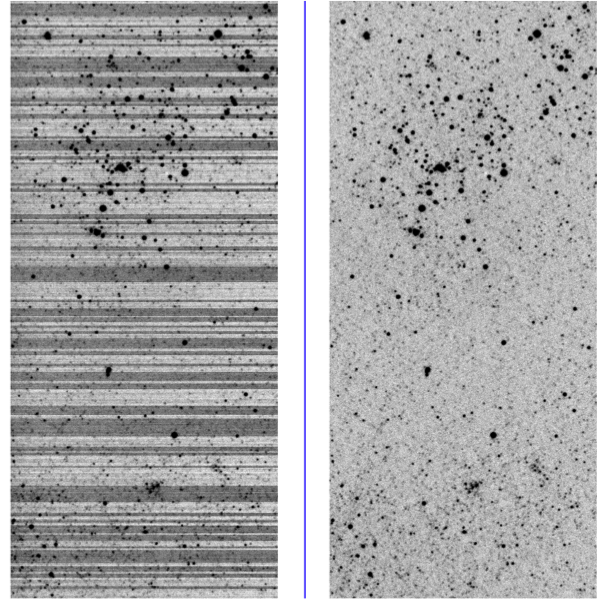
The following figure compares two example EDR images with their much cleaner DR1 version. Most of the apparent difference results from the new bias treatment, which needs ten principal components per amplifier to capture the range of possible behaviour.

Caveats and Known Issues^ Back to top
For an up-to-date list of known issues and their prospects for resolution, please see the Known Issues section at the bottom of this page. There are several important issues with DR1 data to be aware of:
-
No illumination correction has been applied, but work is underway to enable such a correction in future data releases.
-
No fringe correction is applied to Shallow Survey data. However, the fringe amplitude in i-band and z-band should be mostly below +/-2 counts.
-
Some images have bad WCS solutions in the corner CCDs; individual CCDs were removed from mosaic images and catalogues when the astrometry appeared too uncertain.
- The u-band has a ~1% red leak at 700-750 nm wavelength. The relative throughput of the leak is airmass-dependent and can seemingly increase the u-flux of red objects towards higher airmass.
-
Photometry is affected by a spatially-varying PSF across the field-of-view, and the PSF shows trefoil in the corners and generally significant wings.
-
PSF magnitudes are from a fast 1D growth curve fit that is calibrated per image and CCD by bright stars and has parameters as a function of the image x,y coordinates. They can be affected by neighbours within 15" distance. All point sources without neighbours within 15" should have unbiased PSF magnitudes, but those with neighbours will show a worse chi2_psf and biased magnitudes.
- Extended-source photometry has not been optimised in DR1, as the vast majority of sources brighter than 18mag are expected to be point-like.
-
The photometric zero-points for DR1 are derived through comparison to the AAVSO Photometric All-Sky Survey (APASS), including several enhancements compared to the Early Data Release such as improved APASS-to-SkyMapper transformations and improved reddening correction within that transformation.
Current zero-point uncertainties have been estimated by comparing the DR1 photometry against the SDSS Southern Standards by comparing their measured photometry with a prediction based on our photometry and colour terms discussed below. After subtracting the 0.03 mag zero-point offset in SDSS u' reported by Pickles & Depagne (2010), we find that our photometry is on average 1.0+/-0.1% brighter than the SDSS Southern Standards photometry in all six bands. Among the comparison stars we find an rms scatter between the measured and predicted SDSS photometry and of 3.5% in the bands gr, 5% in uiz and 8% in the narrower v-band.
SkyMapper Detectors^ Back to top
The SkyMapper mosaic camera contains 32 CCDs of 4096 x 2048 pixels with a plate scale of ~0.50 arcsec/pixel. There are small gaps between the individual CCDs and the resulting field-of view is 2.37 deg x 2.39 deg. The mosaic fill factor is 91% of a 5.68 deg2 field-of-view. Each SkyMapper image is split into its 32 constituent CCDs, which are presented as separate files to the image cutout service.

SkyMapper Filters^ Back to top
The SkyMapper filter curves (with atmosphere) are shown below. We have tabulated colour transformations between SkyMapper and other standard filters, as well as predicted star colours and reddening corrections -- they can be found on the page here.

Note that the u-band filter (ultraviolet) is shortward of the Hydrogen Balmer break, while the v-band (violet) is placed between the Balmer break and the Ca H&K 4000AA-break. The u-filter also has a red leak, which needs an airmass-dependent correction. The two lines shown in the figure below are effective transmission curves including atmosphere for airmasses 1 and 2. The third (inset) panel shows the difference between the apparent u-magnitudes observed at airmass 1 and airmass 2 as a function of star colour. The redder the star the brighter it appears in u-band as it is observed closer to the horizon, because calibration stars get fainter, while the red leak keeps the flux bright. Additional information on the filter set can be found in Bessell et al. (2011).

World Coordinate System^ Back to top
Reduced SkyMapper images provided through this website and the SIAP service have been registered onto the sky using the TPV World Coordinate System (RA---TPV, DEC--TPV). TPV builds on the standard TAN projection by adding a general polynomial distortion suitable for wide-field cameras which is described in a set of additional PVi_m keywords. A typical TPV header is reproduced below:
| Typical TPV FITS header |
|---|
WCSAXES = 2 / WCS dimensionality CTYPE1 = 'RA---TPV' / WCS projection type for this axis CTYPE2 = 'DEC--TPV' / WCS projection type for this axis LONPOLE = 180.0 / WCS coordinate rotation: longitude LATPOLE = 0.0 / WCS coordinate rotation: latitude CRVAL1 = 276.914401980 / RA of reference point CRVAL2 = -9.384011927 / DEC of reference point CRPIX1 = -2.900864031 / X reference pixel CRPIX2 = -63.233494932 / Y reference pixel CUNIT1 = 'deg ' / X pixel scale units CUNIT2 = 'deg ' / Y pixel scale units CD1_1 = -0.000138209 / WCS transformation matrix CD1_2 = -0.000000195 / WCS transformation matrix CD2_1 = 0.000000225 / WCS transformation matrix CD2_2 = -0.000138246 / WCS transformation matrix RADESYS = 'ICRS ' / WCS reference frame PV1_0 = 0.000042557 / WCS projection distortion parameter PV1_1 = 1.000461443 / WCS projection distortion parameter PV1_2 = 0.000190561 / WCS projection distortion parameter PV1_3 = -0.000000012 / WCS projection distortion parameter PV1_4 = 0.001420356 / WCS projection distortion parameter PV1_5 = 0.000230202 / WCS projection distortion parameter PV1_6 = 0.000277876 / WCS projection distortion parameter PV1_7 = 0.000002261 / WCS projection distortion parameter PV1_8 = 0.000006422 / WCS projection distortion parameter PV1_9 = 0.000001831 / WCS projection distortion parameter PV1_10 = 0.000000521 / WCS projection distortion parameter PV1_11 = -0.000000298 / WCS projection distortion parameter PV2_0 = 0.000071788 / WCS projection distortion parameter PV2_1 = 1.000381476 / WCS projection distortion parameter PV2_2 = 0.000493742 / WCS projection distortion parameter PV2_3 = 0.000000007 / WCS projection distortion parameter PV2_4 = 0.000440372 / WCS projection distortion parameter PV2_5 = 0.000927121 / WCS projection distortion parameter PV2_6 = 0.000817100 / WCS projection distortion parameter PV2_7 = -0.000000338 / WCS projection distortion parameter PV2_8 = -0.000001059 / WCS projection distortion parameter PV2_9 = -0.000001035 / WCS projection distortion parameter PV2_10 = -0.000004152 / WCS projection distortion parameter PV2_11 = -0.000000226 / WCS projection distortion parameter |
As TPV is a relatively recent WCS parameterisation you may need to update older WCS libraries and software for best results. We have confirmed that TPV is supported by the following libraries and tools:
| IRAF | wcstools | wcslib | AST | ds9 | AstroPy | Astromatic | CDS Aladin | IPAC Montage |
|---|---|---|---|---|---|---|---|---|
| 2.16+ | 3.8.4+ | 5.0+ | 5.7.3+ | 7.0+ | 1.1+ | 3/2014 onwards | 9+ | 4.0+ |
Note: older versions of Montage (<=3.3) include wcstools v3.8.1 so this library must be updated to 3.8.4+ prior to compiling in order to support TPV.
Astrometric Quality^ Back to top
The astrometry for DR1 is based upon the UCAC4 catalogue (Zacharias et al. 2013). As validation of the astrometric solutions, the sources from the DR1 master catalogue have been cross-matched against the Gaia DR1 catalogue. For robust DR1 sources (those with flags=0, nimaflags=0, ngood>1, and r_psf<17mag), the distribution of Gaia position offsets is:

The sky distribution of the mean Gaia offsets is:
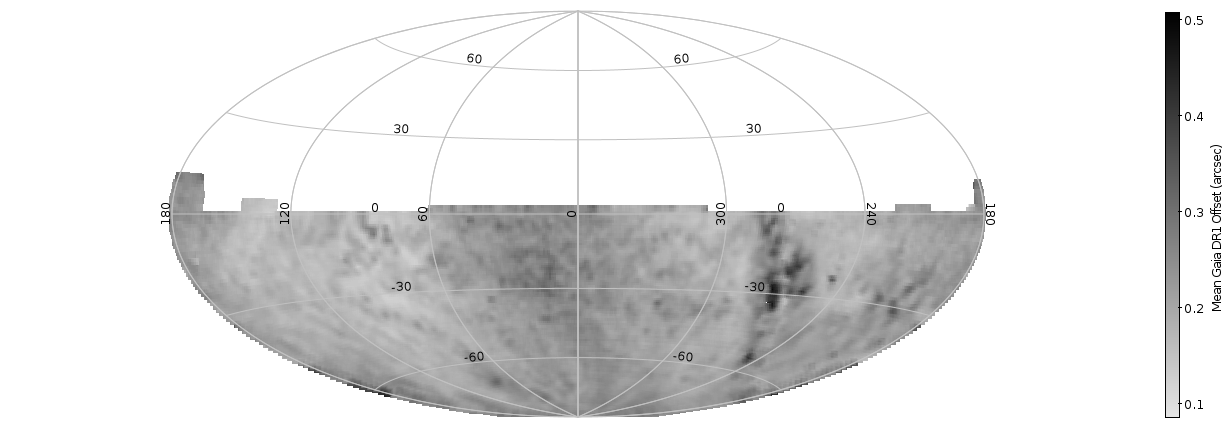
The spatial distribution of SkyMapper DR1 sources without Gaia cross-matches closely resembles the distribution of UCAC4 sources without Gaia cross-matches, which arise due to gaps in coverage and regions of low quality astrometic solutions in Gaia DR1 (see Fig. 6 of Arenou et al. 2017).
Photometric Quality^ Back to top
The photometric zero-points for the SkyMapper DR1 images were determined by comparison with the photometry of APASS DR9 (Henden et al. 2016), accounting for colour transformations between the filter systems and reddening (with the reddening maps of Schlegel et al. 1998).
Point Sources
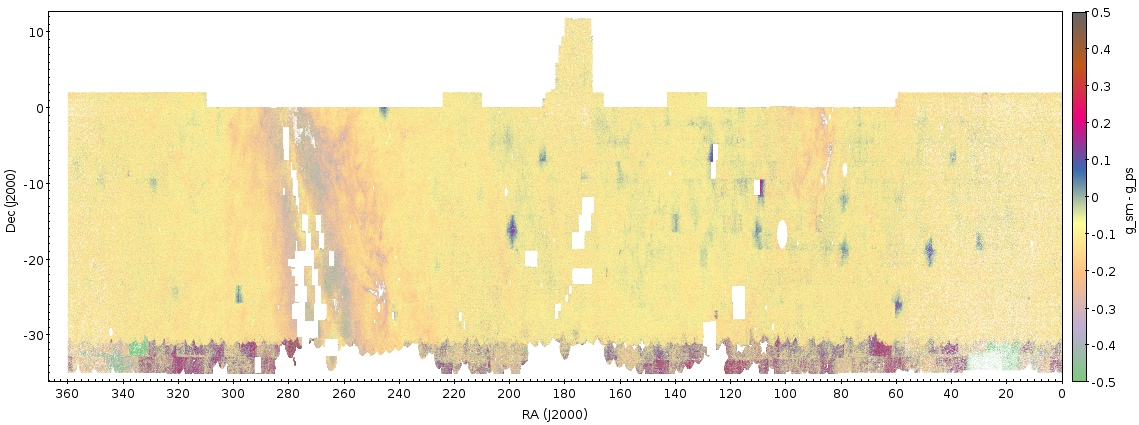
We have compared the SkyMapper DR1 griz photometry to that of Pan-STARRS1 DR1. Without taking account of differences between the bandpasses of the two surveys, the sky distributions of magnitude differences are:
g-band:
r-band:

i-band: (Figure corrected 2017-07-07)

z-band:
Note that these plots are restricted to SkyMapper DR1 sources with flags = nimaflags = 0, ngood_x > 1, x_psf = 14.5 - 17.5mag, Pan-STARRS1 cross-match distances < 2", and Pan-STARRS1 DR1 n_detections > 1. The bright-end limit is imposed to avoid large systematic differences arising from sources above the typical Pan-STARRS1 saturation limit. While not exclusively restricted to point sources, they are the vast majority of sources shown in the figures above.
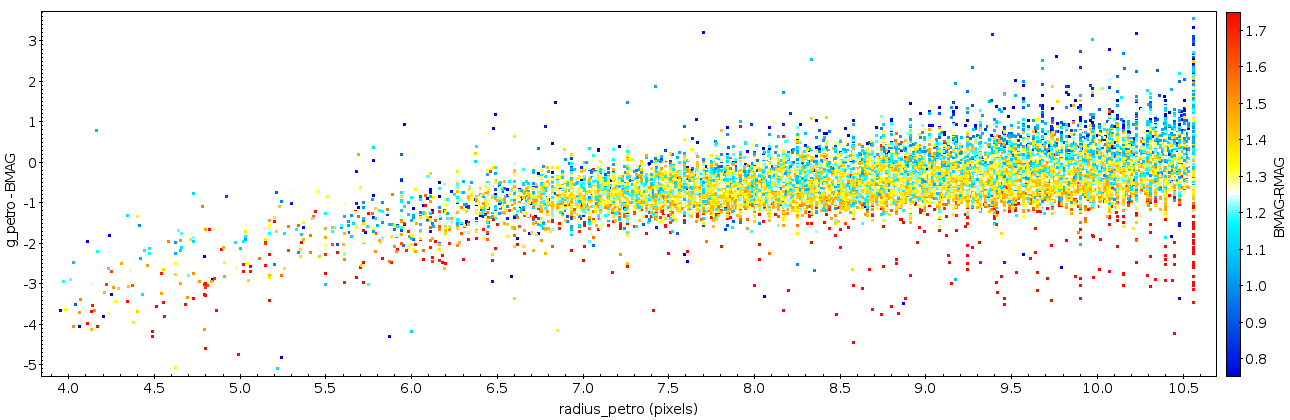
Extended Sources
For extended sources, we have compared the SkyMapper DR1 Petrosian magnitudes with the final photometry from the 6dF Galaxy Survey of low-redshift galaxies (Jones et al. 2009). The rms in (g_petro-BMAG) or (r_petro-RMAG) shows a strong trend as a function of the mean r-band Petrosian radius (radius_petro in the SkyMapper DR1 master catalogue), with a residual rms of ~0.3mag. The comparison here is limited to SkyMapper DR1 sources with flags = nimaflags = 0 and g_petro < 17.5mag.
Known Issues | DR1^ Back to top
Click on the table headings to sort the table based on that value.
| Issue ↕ | First affected release ↕ | Resolved in ↕ | Last modified ↕ |
|---|---|---|---|
| Extended-source photometry | EDR | — | Jul 13 2023, 19:26 AEST |
| Incorrect photometry when merging child objects | DR1.1 | DR4 | Jul 13 2023, 19:25 AEST |
| Zero-point calibration | EDR | DR2 | Feb 13 2019, 16:21 AEDT |
| Pan-STARRS1 DR1 coverage for cross-matching | DR1.1 | DR2 | Feb 13 2019, 16:20 AEDT |
| Fringe correction | EDR | DR2 | Feb 13 2019, 16:20 AEDT |
| Spatial variation of zero-point systematics | DR1.1 | DR1.1 | May 16 2018, 12:54 AEST |
| Corrected description of 'prox' column in master table | DR1.1 | DR1.1 | Jun 21 2017, 16:04 AEST |
| Spatially varying PSF affecting photometry | EDR | — | Jun 05 2017, 15:55 AEST |
| ZIP file downloads in Safari (for info) | EDR | — | May 02 2016, 12:21 AEST |